Cost of Permitting Delays
How Project Delays Increase New Home Prices
Executive Summary
Delays in permitting can cost home builders—and thus home buyers—thousands of dollars on each home. This report analyzes the costs associated with permit delays in select jurisdictions in Washington.
Statewide, the average permit delay is 6.5 months, resulting in a total holding cost of $31,375. Only 24% of families can afford to purchase a newly built home, whereas 76% of families cannot. With a statewide housing shortage of almost 270,000 units, delays of any kind exacerbate our shortage and affordability crises. For every $1,000 added to the cost of constructing a new home, 2,200 families lose their ability to purchase a new home (National Association of Home Builders, Priced-Out Estimates 2022). As a result, the average permit delay of 6.5 months pushes 69,025 Washingtonians out of their ability to buy a new home.
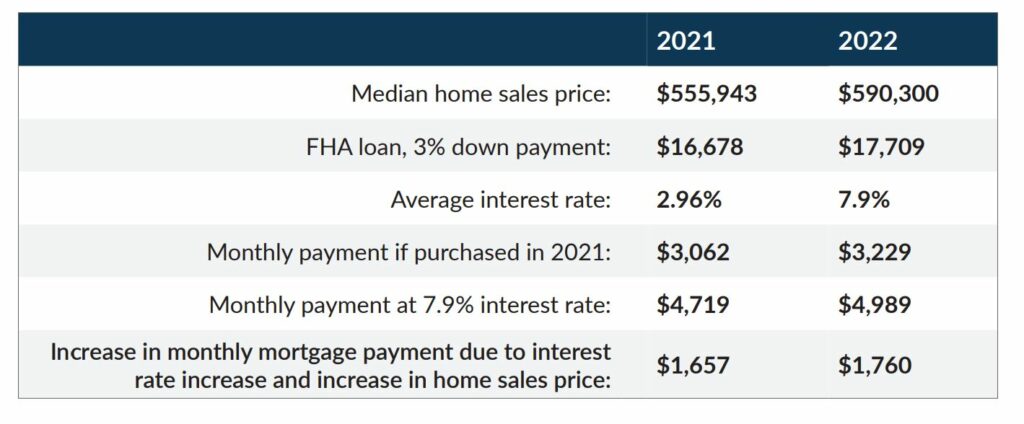
This is up from 57,855 families priced out in March 2022. In an effort to curb inflation, the Federal Reserve has dramatically increased the cost of borrowing since our last iteration of this report. Increases in interest rates substantially diminish the buying power of a potential home buyer.
Washington Home Buyer Purchase Power (2021 vs. 2022)

For each $1,000 added to the cost of a newly built home in the state, approximately 2,200 families are priced out of the opportunity to own a home.
National Association of Home Builders, Priced-Out Estimates 2022
Introduction
This report analyzes permit approval timelines by county and analyzes how permitting timeline delays affect holding costs that drive up the final sales price of a home.
Holding costs: Expenses associated with owning a property. Such expenses are usually paid monthly by a builder and/or homeowner and include charges for:
- Financing payments
- Property taxes
- Insurance
- Gas, electric, water
- Trash collection
- Homeowners Association (HOA) or condo fees
- Business operation overhead
Holding costs may dramatically increase the final sales price of a newly constructed home. While prospective homeowners can buy vacant lots and obtain loans to build new homes, home builders also purchase lots and build on land. Typically, builders will either presell a home before vertical construction begins or sell after they complete construction. The latter is typically referred to as a “spec” or speculation home.
The pre-construction phase of any building includes evaluating the site, submitting permits, meeting inspection requirements and addressing any other special situations that must be resolved before or during construction. As such, the timeline of a pre-construction phase can vary widely between the jurisdictions in which construction occurs.
Home builders frequently complain about the time it takes to receive permit approvals from local building departments. Timelines for permit approvals vary by jurisdiction, with major discrepancies between cities and counties due to staffing levels, the experience level of staffing, process pinch points, level of completeness of submitted permits and the availability of permit applications in languages other than English.
BIAW takes an active role in helping local home builders’ associations across the state educate their members on the importance of completing permit applications with accurate information to reduce the likelihood of a bottleneck within the approval process. Despite this, they still face permit approval delays due to:
- Jurisdictions requiring more information than necessary for the scope of the project
- Redundant and arbitrary internal processes (such as requiring sign-off by multiple contacts within the jurisdiction)
- Bottlenecks in the permitting process (such as permits stuck in stormwater review when other reviews could be completed simultaneously.)
This report ranks counties by permit approval timeline delays and details the associated holding costs.
Methodology
Joseph Gyourko is the Martin Bucksbaum Professor of Real Estate, Finance and Business & Public Policy at The Wharton School of the University of Pennsylvania. He has published numerous pieces of research on housing and economics. When BIAW reviewed the appendix and data set from the 2018 Residential Land-Use Regulation Survey, referenced in “The Local Residential Land Use Regulatory Environment Across U.S. Housing Markets: Evidence from a New Wharton Index*” and calculated the holding costs associated with permit approval delays in counties with data available.
To calculate holding costs, we tabulated the median new home price from the National Association of Home Builders’ 2022 Priced-Out Study. After finding median home prices, we calculated the total down payment required for the minimum 3% down payment that lenders require. Then we calculated the 30-year fixed mortgage loan monthly payment. It’s important to note that with the minimum 3% down payment assumption, we included private mortgage insurance payments required each month in addition to applicable taxes, insurance, and interest (which we assumed a 7.9% rate based on a 700-719 credit score). These additional monthly fees represent approximately 30% of the monthly payment owed. The remainder of the monthly payment amount can then be conceptualized as the principal amount.
Once we gathered this data and organized it into a table, we inserted the permit approval delays per county referenced in the data set. To calculate holding costs, we simply multiplied the monthly mortgage payment by the number of months that permit approvals were delayed.
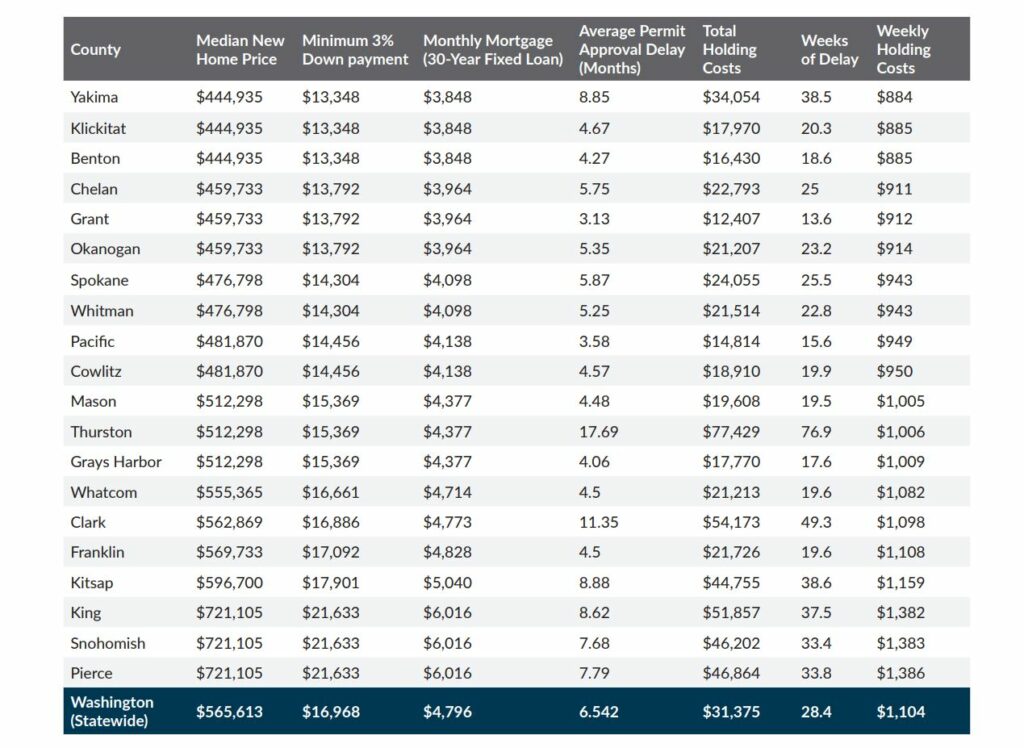
Below, you will see counties organized by permit approval delay timelines and holding costs.
Source
*Gyourko, J., Hartley, J., Krimmel, J. (2019, December). The Local Residential Land Use Regulatory Environment Across U.S. Housing Markets: Evidence from a New Wharton Index. Working Paper 26573: https://www.nber.org/papers/w26573
Limitations
This report has limitations due to the assumptions used for calculating holding costs:
Too many variables exist within the scope of home building and financing
The holding costs referenced in the table on the following page should be considered for illustrative purposes only as not all variables can be captured adequately to provide a true holding cost calculation.
Does not consider builder operation costs
Holding costs illustrated are only representative of the costs a homeowner would incur. This means that the holding costs reflected in the table are artificially low if applied to home builders.
Does not illustrate the holding costs of construction loans
Construction loans are interest-only loans that come in two forms (see below). Because it’s harder to access data that tells us which loan product is more often selected by borrowers, and the averages associated with settlement fees and interest paid per loan product, we have opted to only explore holding costs associated with traditional mortgages.
- Construction-to-permanent loan: Where the buyer has a single close, reducing overall fees because settlement fees are paid once, interest rates can be locked, and is automatically converted to a permanent mortgage.
- Construction-only loan: Where interest can fluctuate during the construction timeline and if converting to a permanent mortgage, two sets of settlement fees will be required to be paid.
The reference data set provided by Dr. Gyourko was completed by Building Departments in each jurisdiction
There is a possibility for human error and/or high or low reporting of permit approval delays.
Assumptions of 3% down payment, 30% of monthly mortgage cost as taxes and insurance, and 7.9% interest rate
These assumptions were used as a baseline to illustrate the lowest possible holding cost based on a home buyer who qualified for an FHA loan and could only afford to pay 3% of the purchase price as a down payment. While we’re aware that not all people will qualify for an FHA loan, we believe this represents the lowest barrier to entry to homeownership.
Results
Washington state has an average median new home price of $565,613. Additionally, the state has an average permit approval delay of 6.5 months, resulting in a holding cost of $31,375. This illustrates an increase of $5,077 in total holding costs, up from our previously reported total of $26,298. Overall, we’ve seen an increase in holding costs by $9,028 since our first published report in 2021.
Both median new home prices and interest rates have risen significantly in the last two years due to variables largely out of our realm of control at the state and local levels. What we can control, however, are the costs imposed by the government. Expediting permit timelines is essential to lowering housing costs in Washington. To illustrate, if the average permit only took 5.5 months (instead of 6.5 months), holding costs would be reduced by $4,419.
Below we have ranked the counties with available data in ascending order by weekly holding cost incurred from permit delays.

As data illustrates the longer the delay, the higher the holding costs.
The data shows a correlation between the length of delay and the median new home price in each county. Therefore, one could assume that the longer permits are delayed, the more holding costs a homeowner or builder can expect, and the higher the final sales price of the home will be.
This can have a drastic impact on housing accessibility and affordability for Washingtonians. To ensure that families can access homes without a substantial cost burden (more than 30% of their monthly income is spent on housing), BIAW urges jurisdictions to undergo internal retrospection, identifying any process flaws that hinder permit approvals and drive-up home prices. Further, jurisdictions should stay abreast of technology and other process improvements to ensure that permits are processed in the most efficient way possible.
